


Idea
Hackathons pierce our otherwise intense work schedules with something fun and unpredictable so we always look out for them especially if they are held within our radius of travel.
The National Hack the Government event was unlike other hackathons we’ve previously attended in such a way that it was intended to solve problems; or rather, to ask the right questions for the problems to be understood before they can be solved.
And this was totally different for us, where previously it was mostly about creating the weirdest, overambitious hack you could think of within the time limit.
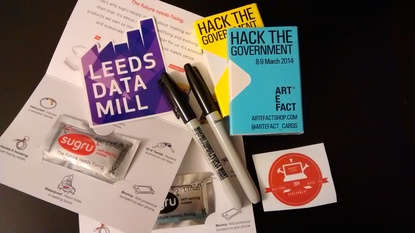
The event was held in the Leeds City Museum, home to many previous hackathons, and from the moment we stepped in, it was clear something was different. There weren’t as many people as we had expected but there was a calm buzz in the air with clusters of people huddling in groups, deep in conversation. As we sat down, the organizers came over to introduce themselves and thanked us for coming. We’re not familiar with their work since we travel in different circles (industry-wise) but as our recent endeavour involve Open Data, it seemed almost perfect timing that Leeds Data Mill was hosting this event so close to where we are.
There were a few suggestions for what you could do with the data supplied through the website and people sorted themselves into the respective groups to tackle these challenges. Within our group, it was amazing to note the vast multidisciplinary backgrounds of the participants.
We didn't really approach the hack with any ideas for what we were going to build but being game developers, building some sort of game is always on the table. Our group branched out into smaller groups since there was a maximum of 4-5 per group and we ended up on our own.
Browsing through the available datasets, we quickly decided that it would be interesting to try and visualise one of them as a game level so rather than just being told what the data was, you would have a chance to experience it instead. What we’ve learnt from creating and playing games and through feedback from players is that you learn in a totally different way compared to the traditional method. Games engage you to interact and this provokes a different kind of response even if the resulting effect is still the same; repetition to memorise.
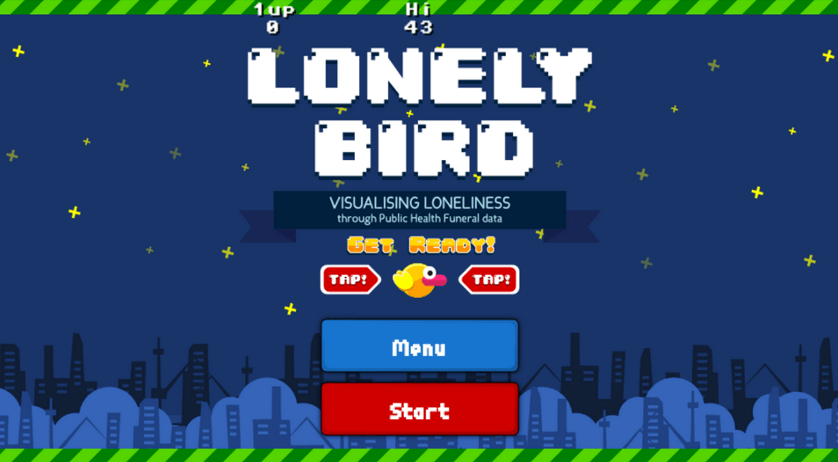
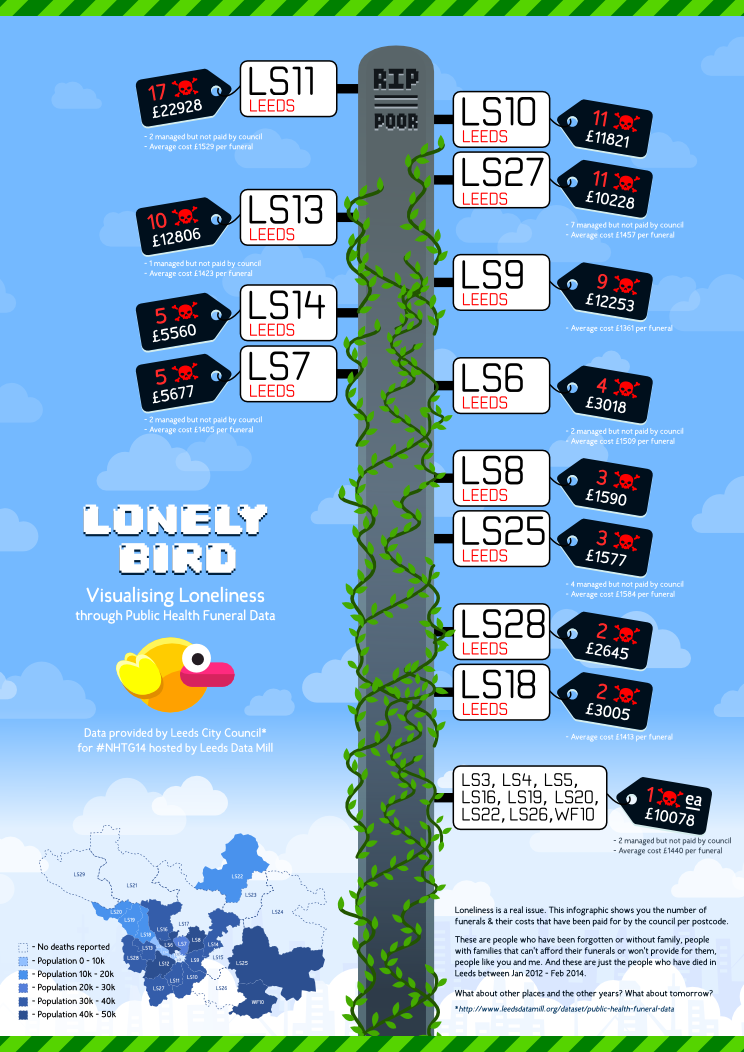
Flappy Bird is a recent media darling and actually a style of game that we felt we could recreate within the time constraints so it ended up being a natural choice. When we looked at the Public Health Funeral Data, it seemed an unlikely thing to be visualised as a game. For that reason, it was clear that it had to be done and after studying the data, we became aware of an issue that was previously unknown to us - Loneliness - so this was something we felt was worth drawing attention to.
Hopefully our intentions are realised!
Mapping The Data
Now comes the interesting bit which might get a little technical but bear with us.
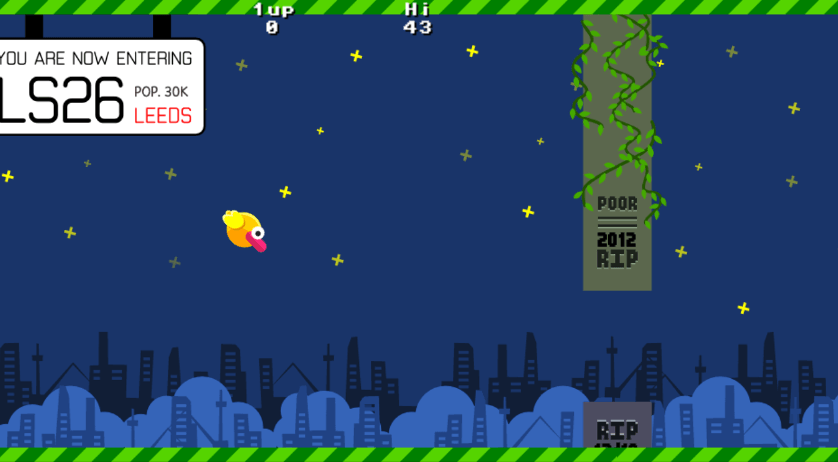
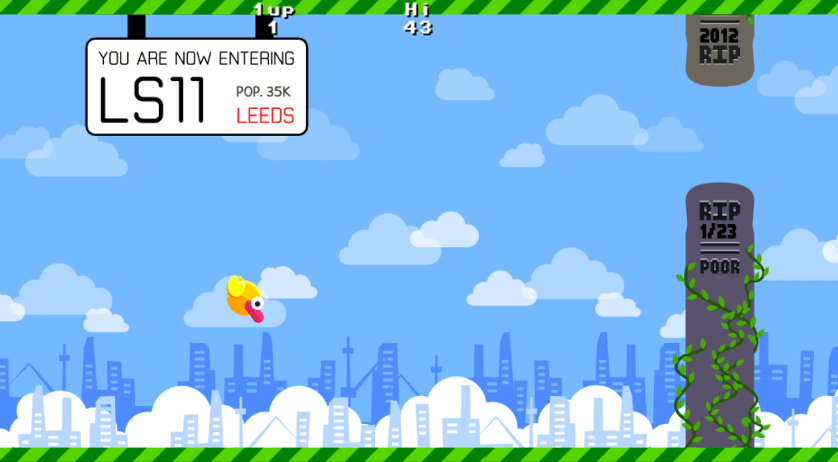
It has to be understood that there is no randomness in the game; all random values are actually derived directly from the data that is mapped into postcode sections. The Leeds postcodes are then displayed prominently prior to entering the section when you play the game.
The idea here is that as you learn the data, you will associate it with each postcode. Putting in a small amount of randomness by randomly deciding which postcode section will come next adds a little unpredictability into the mix so you can memorise each section but not the order they come in as.
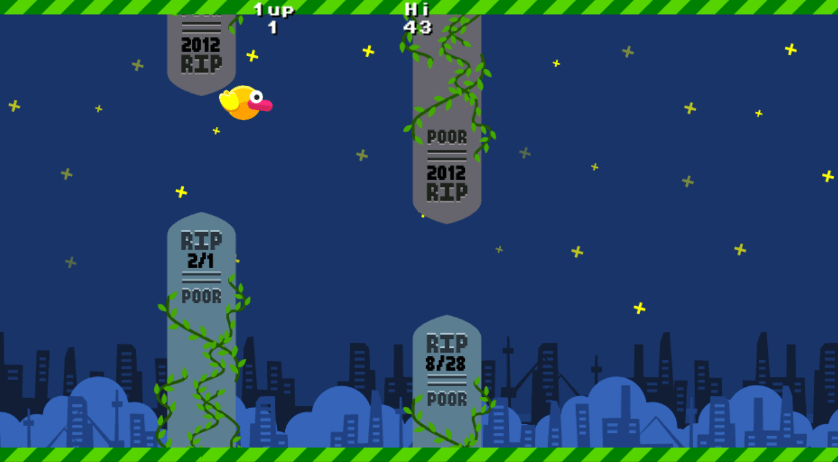
Each funeral is sorted by date. We have about two years of data (Jan 2012 - Feb 2014) and in each postcode section, the data is presented to the player in a simple time line.
Each obstacle is a gravestone with a gap in it. We position the gap at the top of the screen for January and at the bottom of the screen for December (when you fly through a gap lower on the screen, the death occurred in December). Since we also sort by date and have two years worth of data, you can tell when one year ends and another year starts because the gap will jump back up to the top.
The size of the gap, and hence how easy it is to fit through, is driven by the cost of the funeral. A bigger gap means a more expensive funeral and a smaller gap means a cheaper funeral. We found that the prices varied quite a lot but mostly stayed within £1300 - £1600.
The distance between obstacles is the day of the month that the funeral took place on, so if you get a long gap it will mean that the last funeral took place at the end of the month.
Data Quality
Even on a rather small number of data points, we still encountered data quality issues. For instance, most dates are of the 2014-12-31 format but one of them had the year at the end rather than the start and one postcode was missing a letter which took us aback when we had to sort them.
We also had no real idea what some of the columns actually meant but since they were mostly empty, we decided to remove them from the visualisation.
One thing we have learnt from working with other datasets is that you really need access to someone who understands the data. Even with good documentation, you will only learn what people are meant to publish and it takes experience to learn what people are actually publishing and what certain patterns really mean.
Data without context is just not as useful and prone to misinterpretation.
Source code
Lonely Bird was created using our own open source Lua based game engine called Gamecake. We are releasing the full code and art assets as an MIT licensed project. You can find it all in the following repository along with other code examples.
https://github.com/xriss/gamecakejam/tree/master/lonelybird
We have also published the Android build on Google's Play Store which you can download for free and play on your Android phone or tablet. (Don’t worry, it contains no ads.)
https://play.google.com/store/apps/details?id=com.wetgenes.lonelybird
You are free to use, remix and rebuild to your hearts content. A simple change would be replacing the CSV file containing the data with another file or even just newer data to create a new set of levels.
To accompany the game, we’ve also created an infographic in both PDF and PNG formats so you can print those out as posters or use them in any way you like.
https://raw.githubusercontent.com/xriss/gamecakejam/master/lonelybird/art/press/lonelybirdposter.pdf
https://raw.githubusercontent.com/xriss/gamecakejam/master/lonelybird/art/press/lonelybirdposter.png

Final words
The hackathon, we felt, was a great success. It was obvious that the organizers have put in a tonne of effort to create such a welcoming and engaging environment for the participants, not to mention the wonderful food and freebies galore - we’ve never felt so spoilt at an event!
There was clearly an urgency to solve problems, a shared willingness to help. Many of the participants had never been to a hackathon before so was floored by the possibilities you could achieve by sharing ideas with thinkers, designers and doers in one room.
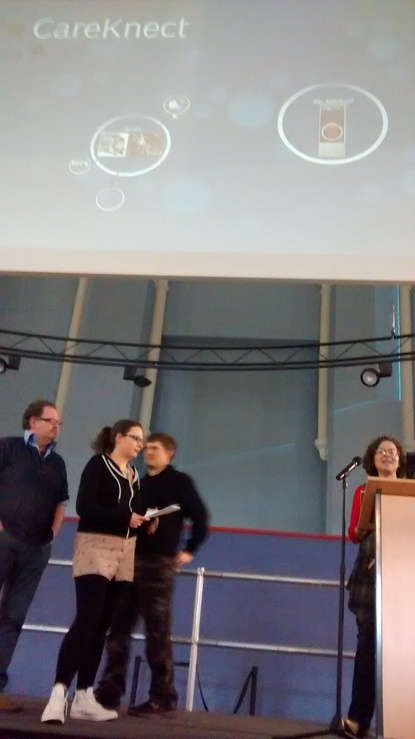
CareKnect asked a simple question - what does it take to be well and stay well? By harnessing the power of other people in your local area, you were able to search what other people like you were doing to be well and where, via similar variables of symptoms or causes. But the most exciting part was the interface - a robot that talks to you on-screen!
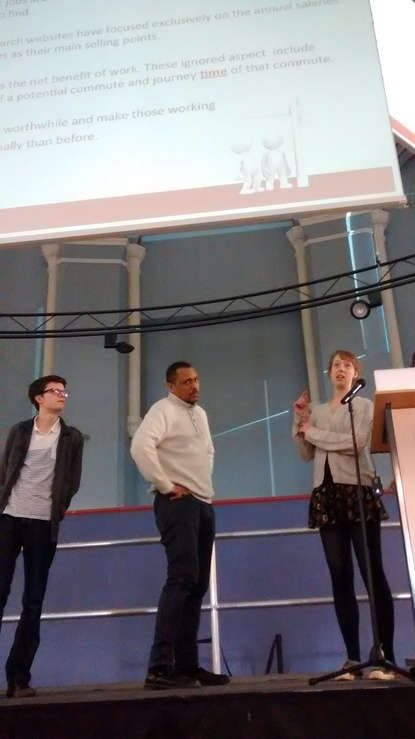
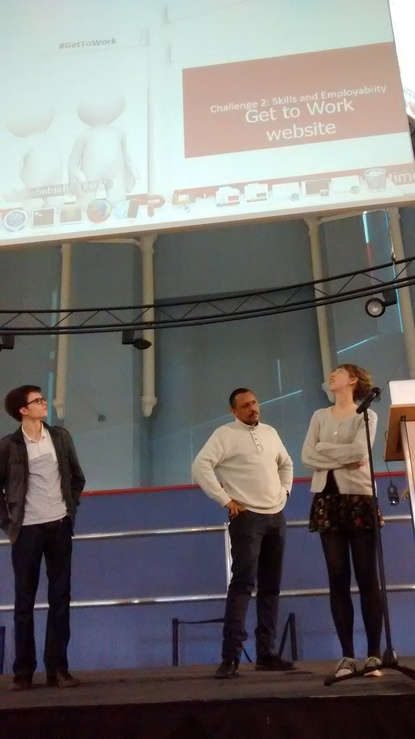
Get to Work tackles the murky waters of employment search. The group used transport data to include the costs of travel from where you live so this got really interesting when you took that into account when displaying and comparing the same job title in different towns. This is when it became obvious that many of the job sites out there are, frankly, rubbish.
City Dashboard will show progress towards meeting six of the priority actions defined in the Leeds Climate Change Strategy (2012-2015). Read more.
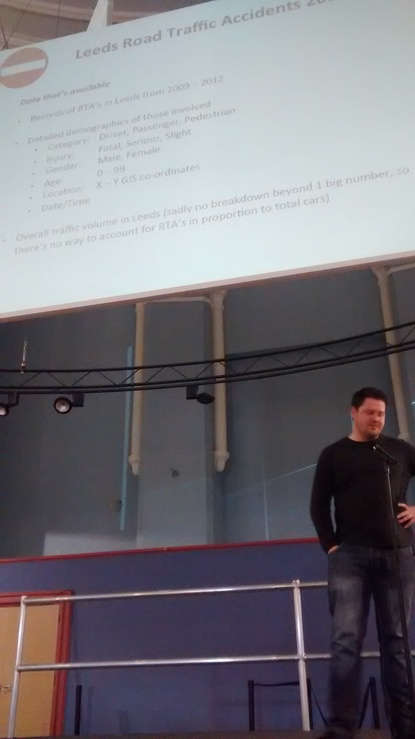
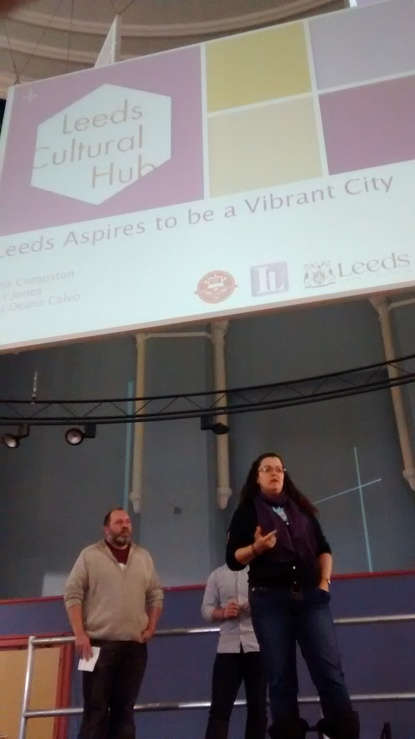
Drive Safe Leeds is a neat little app that calculates the probability of crashing when you're out driving on the road. Leeds Cultural Hub will highlight the cultural offering & levels of participation across the city. Read more.
Finally, Oompah.py is a musical representation of footfall data through the medium of the brass band. Read more.
We’ve had the pleasure of meeting so many wonderful people and are humbled by their ideas and hopes to help others. Thank you for letting us be a part of this! We only wished there was a way to get in touch with the other people we’ve met as we were so engrossed in creating, we forgot to exchange details with everyone.
Before we end, have some Lonely Bird tunes :}
Click here to login if you wish to comment.
View all posts.
View all posts.
11 years ago shi commented on Dr. Bulbaceous: Puzzle Solver...